Lecture Connections: Identifying Colors in Water-Based Inks
| Keyword | General Concept | Explanation |
| mixtures | classifying matter | Two or more substances that are physically rather than chemically combined. A mixture can be separated through physical means (ex. filtering, dissolving in water, etc.) |
| chromatography | properties of matter | Technique used to separate a mixture based on differences in the ability to adhere to surfaces, such as paper |
| solute, solvent | properties of matter | A solvent dissolves a solute. In this lab, water the solvent; ink is the solute. |
| Electron structure | electron structure, electromagnetic spectrum | The movement of electrons from one energy level to some higher energy level after absorbing energy (light) |
| spectrum (pl. spectra) | electromagnetic spectrum; absorbance spectrum | a UV-vis spectrum is produced by absorbing light and indicating wavelength and absorbance |
Paper Chromatography
The concept of ‘chromatography’ was discovered and named in 1906 by Michael Tswett. It is defined as a method by which two or more components in a mixture are distributed between two phases, stationary and mobile. The separation occurs because sample components have different affinities for the stationary and mobile phases. The phases may be gas, liquid, or solid. There are examples of chromatography methods using gas and liquid phases, gas and solid phases, liquid and liquid phases, as well as liquid and solid phases.
Paper chromatography is a specialized form of chromatography that is relatively fast and inexpensive yet powerful enough to separate a range of different chemicals. It is especially well suited for laboratory research where separation and purification of small quantities of materials are often required. In paper chromatography, both phases are liquids. The paper plays no direct role in the separation but rather functions to hold the stationary liquid phase in place. The mobile phase moves up the paper by capillary action. When the solvent comes into contact with the paper, there is an immediate uptake of solvent into the paper. As the solvent (mobile phase) passes over the paper, a solvent front is established. Remember, the solvent moves up the paper regardless of whether a chemical has been placed on the paper. Thus, the solvent front moves up the paper as a function of time .
UV-Visible Spectroscopy
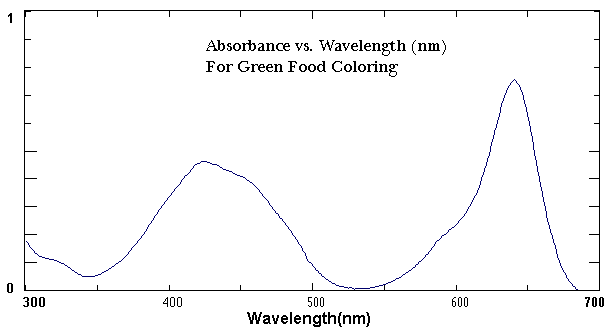
A UV-vis Spectrophotometer is a research instrument used to gather information about a chemical sample. It exposes a chemical solution to the ultraviolet and visible region of the electromagnetic spectrum. Depending on the type of chemical, a certain amount of the light gets absorbed by the chemical which causes electrons to be promoted from one energy level to another. The amount of light that reaches the detector is then recorded as a spectrum as shown in Figure 1.

The UV-vis spectrum shown in Figure 1 plots the wavelength on the X-axis and the absorbance on the Y-axis. In this spectrum, green food coloring shows two distinct absorbance maxima; one peak is at approximately 420 nm with an absorbance of 0.45 while the other is at 640 NM with an absorbance of 0.80. The shape of the spectrum and the wavelength of maximum absorbance are characteristic of the chemical compound. Each of the inks in this experiment will have a peak or peaks at a different location on the x axis.