![]()
Learning Goals
- To prepare samples to use in an instrument called a UV-vis (ultraviolet-visible) spectrometer.
- To collect and analyze data with a UV-vis spectrometer.
- To determine the FD&C food dyes in an assigned flavor of Gatorade™ brand sports drinks.
Abstract
Color plays a vital role in the appearance and appeal of food. Certain foods have a characteristic color that indicates whether a particular food is at peak condition, underripe, or, spoiled. Synthetic food dyes are often used to make foods more appealing. Sometimes dyes may make foods seem a more 'natural' color. Sometimes the dyes are deliberately eye-catching: Think of brightly colored breakfast cereals, frozen ices, and candy.
The types and uses of food dyes have increased dramatically since 1906, when the Food and Drug Act became law, permitting the use of seven dyes in foods. The list has been expanded and modified ever since, based upon the marketability and safety of food dyes. These dyes are now referred to as "FD&C" for the Food Drug and Color Act of 1936.
Interestingly, the color of dyes themselves can be explained by their chemical structure. In this experiment, you will use an instrument called a UV-vis spectrometer to analyze the food dyes in various assigned flavors of Gatorade™.
Pre-lab Assignment
1. View the video clips on Using the UV-vis spectrometer. You will need Quick Time video player to see them.
In your lab notebook, prepare the following information:
2. A brief (2-3 sentence) introduction to the lab.
3. A table of safety information including the chemicals used in the lab and any safety handling precautions.
4. A data table to record the flavor of Gatorade used and the results of the UV-vis spectrometry (See sample table in the Analyzing Data section).
Give this information to your teacher at the beginning of the lab. You will not be allowed to work in the lab without this information.
Procedure
| Chemicals Needed | Equipment and Supplies Needed |
|
|
- Find a lab partner.
- Obtain 6 clean, dry cuvettes.
- Fill the first cuvette half full with distilled water. This solution will be used to "blank" the UV-vis spectrometer.
- Using a 10-ml graduated cylinder, prepare a 1:1 dilution of the Gatorade Fruit Punch (1 mL of each should work). Fill the second cuvette half full with the diluted Gatorade Fruit Punch (FD&C red dye #40).
- Fill the third cuvette half full with Gatorade Glacier Freeze (FD&C blue dye #1)
- Fill the fourth cuvette half full with Gatorade Lemon-Lime (FD&C yellow dye #5).
- Fill the fifth cuvette half full with your assigned Gatorade flavor.
- Fill the sixth cuvette half full with your partner's Gatorade flavor.
- Take the cuvettes, along with your data table to the UV-vis spectrometer. (If you are using a data disk, bring this along as well.)
- Log onto the instrument, using your account name (If you are using a data disk, insert your disk into the computer.) .
- Take the cuvette with the distilled water and use a Kimwipe or similar tissue to remove any water or fingerprints from the clear sides of the cuvette. To blank the instrument, insert the cuvette with distilled water into the instrument holder. Push gently to make sure the cuvette is all the way into the holder. The blank records what the solvent (water) and the cuvette "look like." The instrument then electronically subtracts the cuvette and solvent when it records a sample spectrum. TIP : The clear sides of the cuvette must face the holes in the sides of the sample compartment. The ridged sides should face the front of the machine. Click the 'blank' option.
- To scan the Gatorade Fruit Punch solution, insert the cuvette into the instrument holder and click on the 'scan sample' button. Record the filename of your sample. (The filename consists of the date (yymmdd) and a sample number (ex. 010922~1).
- Scan the Gatorade Glacier Freeze solution. Record the filename.
- Scan the Gatorade Lemon-Lime sample. Record the filename.
- Scan each of the two assigned Gatorade samples. Record the filename. Record the filenames.
- Exit the instrument program and return your samples to the lab. Do not dispose of your samples until you have analyzed your data.
- Dispose of all your chemical samples in the labeled waste containers. Clean all of your cuvettes and glassware.
Analyzing Data with the ICN Program
18. Make sure that you are at the ICN site. Click on the spectral analysis button on the main ICN screen (If you are using a data disk, insert it into the A: drive before you click.). Enter your account name and password. Your spectra files should appear.
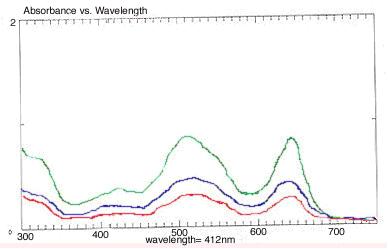
19. a. Find the wavelength of maximum absorbance from the x-axis for each of the known samples. The maximum absorbance is the absorbance reading (y-axis) for the top of the peak. The wavelength for the maximum absorbance is read from the x-axis. The shape and location of the peaks in the UV-visible spectra are defined by the wavelength and maximum absorbance. If more than one peak is present -- as you should find in the secondary colors -- find the wavelength of maximum absorbance for each peak. Record these values.
b. You can 'zero in' on the spectra by changing the scale of the x- and y-axis. For example, to change the absorbance scale, highlight the '4' and type in '1'. You may change the wavelength scale by highlighting the '750' and typing '700'.
20. Summarize the data in the following data format:
Gatorade flavor # of peaks in visible light range Wavelength(s) of maximum absorbance Absorbance at Wavelength of Maximum Absorbance
Questions for Analysis:
(Include the answers to these questions in your lab report)1. Colored compounds produce UV-vis spectra in the visible range of the electromagnetic spectrum (400-700 nm). Different colored compounds produce spectra with a characteristic shape and maximum absorbance. What was the wavelength and maximum absorbance for each color food dye? (See example.) Record the wavelength and maximum absorbance for each food dye in a data table.
Example

The maximum absorbance is the absorbance reading (y-axis) for the top of the peak. The wavelength for the maximum absorbance peak is read from the x-axis.
2. Compare your known Gatorade food dyes to your assigned Gatorade samples. If your Gatorade has a particular food dye, the spectrum from the Gatorade sample will have a peak at the same wavelength as the peak on the food dye. List the food dyes contained in your Gatorade sample.
3. Label each spectra for the food dyes and Gatorade sample. Print out copies of each of your spectra. Attach the spectra printouts to your lab report. Include the filenames for each spectra in your lab report.
4. a. For each for each different wavelength listed in your data table, list the color of the visible light spectrum that wavelength represents. (Example: sample color, wavelength, visible spectrum color).
b. How does the spectrum color compare with the color your eye detects?
5. Which samples produced more than one peak in the visible light range? Did any samples have more than two peaks?
6. Explain how more than one peak might be produced?
Lecture Connections Questions
7. Examine the three spectra below from a single Gatorade flavor. What causes the difference seen in the spectra? What color is the Gatorade?