Primary Colors Lab -- Teacher Background
1 lab period for wet lab
1 class period for spectral analysis and preparation
Learning Goals:
- Prepare samples for UV-visible analysis.
- Collect data on a UV-visible spectrometer.
- Analyze spectra of primary colors.
- Analyze a spectrum of a secondary color.
Equipment/Materials:24 students working in pairs
| Chemicals Needed | Equipment and Supplies Needed |
|
|
* McCormack's brand food coloring was used in developing this laboratory experiment.
Solution Preparation: Standard food coloring straight from the bottle will be too concentrated to prodcue useable spectra. The table lists dilutions of different food colorings that will produce the maximum and concentrations readable by the spectromter. as well as a dilution that will produce a so-called 'ideal spectrum' somewhere in the middle of the range. You may find that because drop size from the food coloring bottles is inconsistent and somewhat difficult to control, the actual dilutions may vary from the specifics listed here. Distilled or tap water may be used to dilute the food coloring.
| Food Coloring | Maximum Concentration | 'Ideal' Concentration | Minimum Concentration | Peak Location/Absorbance: Maximum Concentration | Peak Location/Absorbance: 'Ideal' Concentration | Peak Location/Absorbance: Minimum Concentration |
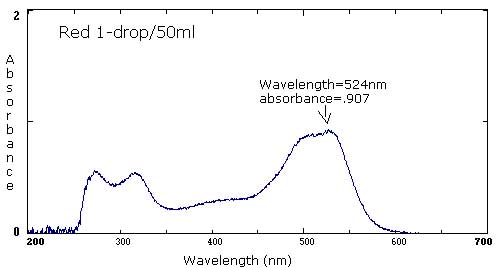
| Red | 1 drop/40 mL | 1 drop/50 mL | 1 drop/400 mL |
524 nm/1.231 324 nm/.875 271 nm/.795 |
524 nm/.907 317 nm/.532 271 nm/.565 |
525 nm/.091 264 nm/.147 |
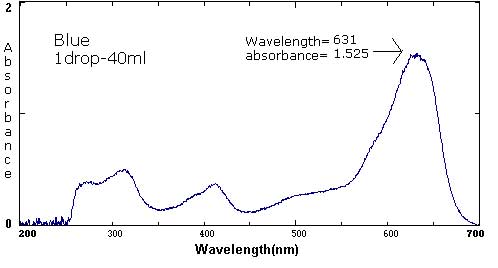
| Blue | 1 drop/30 mL | 1 drop/40 mL | 1 drop/425 mL |
631 nm/1.556 413 nm/.329 313 nm/.448 |
631 nm/1.525 413 nm/.369 313 nm/.502 |
633 nm/.174 269 nm/.127 |
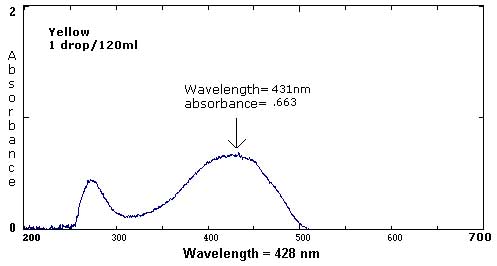
| Yellow | 1 drop/40 mL | 1 drop/50 mL | 1 drop/425 mL |
411 nm/1.153 275 nm/.894 |
431 nm/.663 273 nm/.441 |
432 nm/.038 265 nm/.058 |
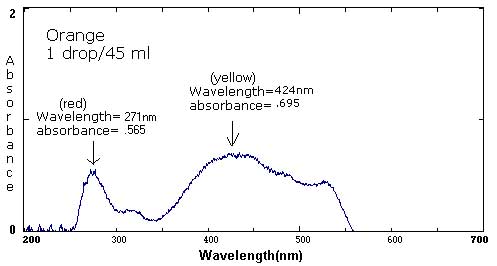
| Orange** | 1 drop each red and yellow/160 mL | 1 drop each/90 mL | 1 drop each/800 mL |
424 nm/.845 269 nm/.845 |
424 nm/.695 273 nm/.515 |
424 nm/.079 269 nm/.043 |
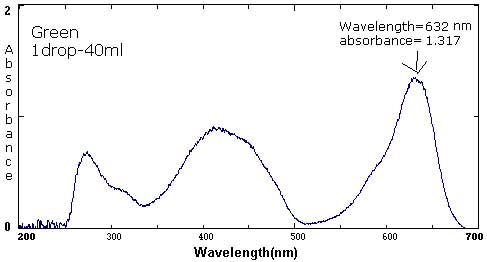
| Green | 1 drop/25 mL | 1 drop/40 mL | 1 drop/420 mL |
632 nm/1.31 415 nm/.987 271 nm/.655 |
632 nm/1.317 415 nm/.890 271 nm/.655 |
631 nm/.053 419nm/.035 |
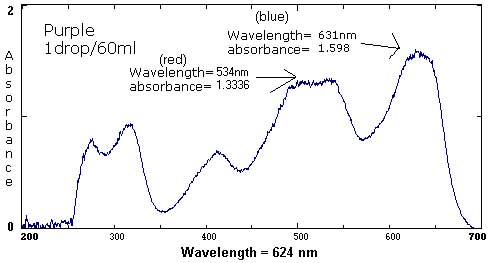
| Purple** | 1 drop each red and blue/ 60 mL | 1 drop each/ 120 mL | 1 drop each/ 800 mL |
631 nm/1.598 542 nm/1.426 524 nm/1.333 411 nm/1.182 321 nm/1.219 |
631 nm/1.583 532 nm/1.334 413 nm/.686 316 nm/.920 277 nm/.771 |
631 nm/.033 |
** These solutions were made by mixing 2 individual food dyes. Because two drops were used, the amount of water used was doubled.
Sample Data: We have included sample food coloring spectra as a reference. Please keep in mind that different brands, different colors, and different techniques will affect the exact wavelength and absorbance values.
The following six spectra represent 'ideals' from the primary and secondary colors.
The follow spectra represent maximum and minimum concentrations of the labeled food colorings.
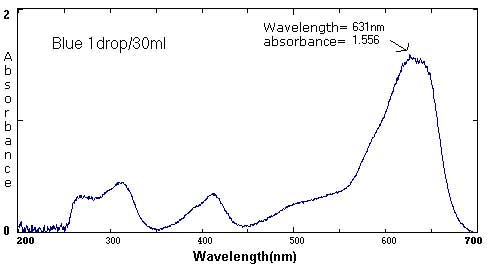
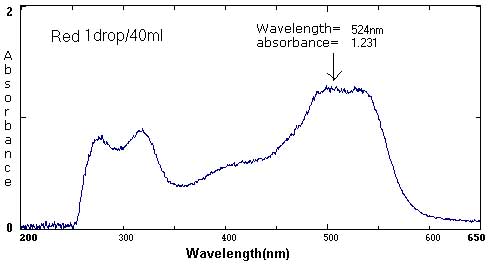
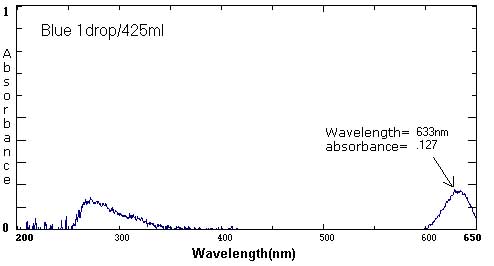
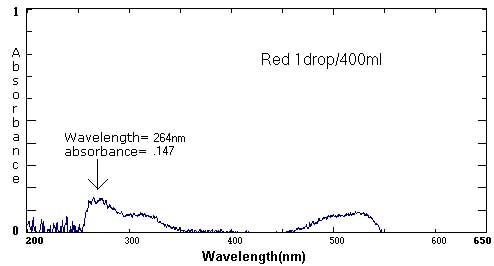
At the extremes, the spectra curves start to 'break up'. They become more jagged. The peaks are less distinct. At the maximums (highest concentrations), the peak may become a plateau, a flattened curve with no identifiable peak.
Safety: Students should follow general safety procedures regarding the handling of glassware.
Disposal: All materials are nontoxic. Although solutions may be flushed down the drain, it is good training for students to empty their cuvettes into labeled waste or used-materials containers. This procedure will encourage good disposal habits when more hazardous materials are used in the lab.
Suggestions:
The following problems relate concentration and absorbance. They may be used to assess individual student understanding of spectroscopy, for small group problem solving, or for whole-group discussion.
Given the following spectra taken from chemical samples, what would you predict for a spectra if the two chemical samples were mixed?
a.
b.
c.
d.
Troubleshooting:
To correct poor spectra, try one or more of the following suggestions:
1. Blank the machine. Listen for the click that signals the blank has been read. Re-scan samples.
2. Be sure the cuvette is clean and dry, and inserted properly into the holder. (Moisture or fingerprints on the clear sides of the cuvette can interfere with the machine's reading.)
3. If the spectra are showing either jagged peaks or flattened plateaus instead of distinct, smooth peaks, the solution may be too concentrated. Dilute the solution and re-scan the sample.
4. You may also view the Spectra Library of Common Mistakesfor further comparison.
Maine State Learning Results (MSLR): This lab encourages skills listed in the following performance indicators under content area for secondary scores:
E. The Structure of Matter:
J. Inquiry and Problem Solving
Students will apply inquiry and problem-solving approaches in science and technology. Students will be able to:
- Make accurate observations using appropriate tools and units of measure.
- Verify , evaluate, and use results in a purposeful way. This includes analyzing and interpreting data, making predictions based on observed patterns, testing solutions against the original problem conditions, and formulating additional questions.
- Demonstrate the ability to use scientific inquiry and technological method with short-term and long-term investigations, recognizing that a there is more than one way to solve a problem. Demonstrate knowledge of different strategies.
K. Scientific Reasoning
Students will learn to formulate and justify ideas and to make informed decisions. Students will be able to:
3. Develop generalizations based on observations
4. Determine when there is a need to revise studies in order to improve their validity trough better sampling, controls, or data analysis techniques.
L. Communication
Students will communicate effectively in the application of science and technology. Students will be able to:
3. Make and use appropriate symbols, pictures, diagrams, scale drawings, and models to represent and simplify real-life situations and to solve problems.
4. Employ graphs, tables, and maps in making arguments and drawing conclusions.
7. Use computers to organize data, generate models, and do research for problem solving.

