The Beer Lambert Law (a.k.a. Beer's Law)
* * *
Background Information
**The Beer Lambert Law
One of the keys to quantitative analysis in any scientific field is the assumption that the amounts (concentrations) of the constituents of interest in the samples are somehow related to the data from a measurement technique used to analyze them. The ultimate goal is to create a calibration equation (or series of equations) which, when applied to data of "unknown" samples measured in the same manner, will accurately predict the quantities of the constituents of interest.In order to calculate these equations, a set of "standard" samples are made which reflect the composition of the "unknowns" as closely as possible. These standards are designed to span the expected range of concentrations and compositions in the unknowns and are measured under the same conditions as the unknowns. The standards are then measured by an instrument. Together, this collection of known data (the composition of each standard) and the measured data from the instrument form what is known as a training set or calibration set. The calibration equations that describe the relationships between these two sets of information are calculated from this data. The exact equation or set of equations that make up the calibration is also known as a model. Thus, this process is often called, "solving the calibration model."
Once the model equations have been selected and solved, they can be used to calculate the same quantities or properties in "unknown" samples. However, in order for these sample(s) to be predicted accurately, they must be measured under exactly the same conditions on the same instrument as the calibration set.
For many current applications, a spectrometer is increasingly becoming the measurement device of choice. Unlike other methods which give "single point" measurements for each calibration and unknown sample (i.e., pH, or single element Atomic Absorption), the spectrum of a sample contains many data points. Every response value in a spectrum has some relation to the properties or constituent(s) that make up the measured sample. Using a spectrum of a sample that has many data points has some distinct advantages over single point measurement techniques. One of the most important factors is that there are many more measurements per sample (spectral data points) to use in generating the calibration equations. As anyone who has performed quantitative analysis knows, the more measurements per sample, the more accurate the results. The problem for the analyst is to discover what those relationships are, and use a calibration model that reflects them accurately.
One advantage of using spectroscopy as a measurement technique is that the Beer-Lambert Law (also know as Beer's Law) defines a simple linear relationship between the spectrum and the composition of a sample. This law, which should be familiar to all spectroscopists, forms the basis of nearly all other chemometric methods for spectroscopic data. Simply stated, the law claims that when a sample is placed in the beam of a spectrometer, there is a direct and linear relationship between the amount (concentration) of its constituent(s) and the amount of energy it absorbs.**
**from "Algorithms: The Beer Lambert Law". Downloaded from Internet July 7, 2002 <<http://www.galactic.com/Algorithms/beer_lambert.htm.>>
Sample Application from the Sunscreen Analysis Lab
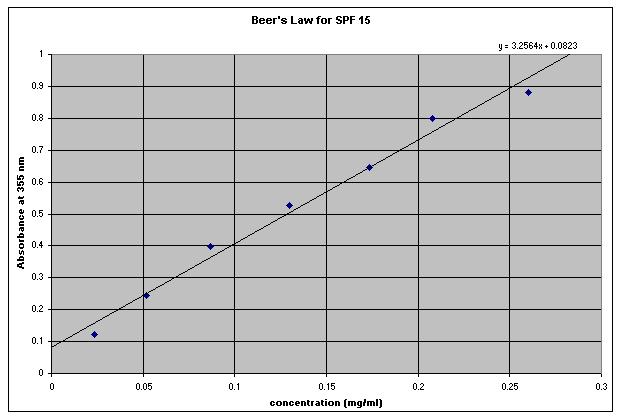
Given the absorbance versus concentration data below, a scatterplot was constructed in Microsoft Excel. A trendline was then fitted to the data. Its equation has been displayed on the chart. Given the equation in the graph, one can solve for the concentration of an unknown sample of SPF 15 given its absorbance at 355 nm (which can be obtained by scanning it in a UV-VIS spectrophotometer).
|
Concentration (mg/ml)
|
Absorbance at 355 nm
|
|
0.0236
|
0.122
|
|
0.0520
|
0.244
|
|
0.0867
|
0.397
|
|
0.1300
|
0.526
|
|
0.1733
|
0.647
|
|
0.2080
|
0.799
|
|
0.2600
|
0.881
|